The U.S. Bureau of Labor Statistics is scheduled to release the October Consumer Price Index at 8:30 a.m. Eastern Time on November 10. That is 9:30 p.m. in China. The figures are not available yet, so any account of October inflation published before then should treat the release as pending.
The last available report, for September, showed that the CPI for All Urban Consumers rose 0.6% from the previous month after seasonal adjustment. Prices were up 3.7% over the 12 months through September. The index excluding food and energy rose 0.3% for the month and 2.6% over the year.
Those figures offer context for today’s release, but they do not tell us what October’s numbers will be. A careful read starts with what the CPI measures, then looks at how different categories contributed to the total.
What the CPI measures
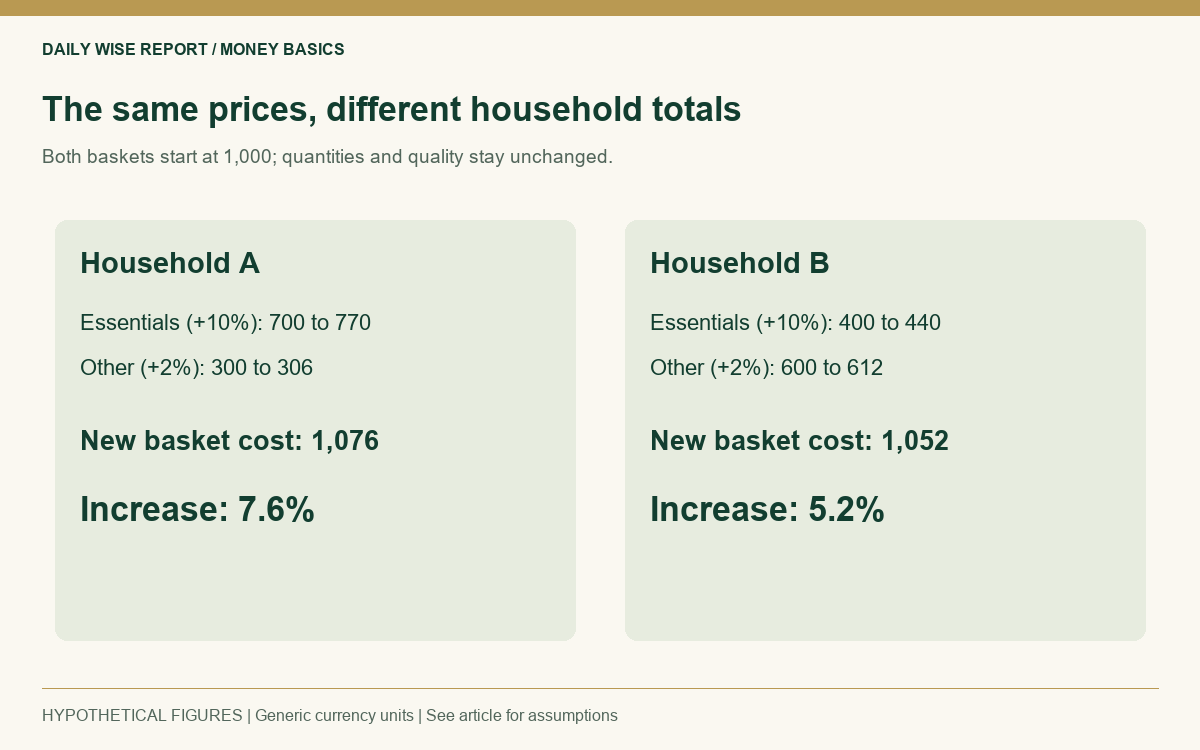
The CPI tracks changes over time in prices paid by urban consumers for a representative basket of goods and services. It includes categories such as food, rent, transportation, medical care, and energy. The national average reflects spending patterns across a broad population. A household’s own inflation experience can differ if its budget gives more weight to items whose prices are changing quickly.
The CPI is a U.S. measure. It cannot describe inflation in other countries, where household spending, data methods, currencies, and price changes may be different. Even within the United States, a national figure does not capture every city or household.
Look at the monthly and yearly changes
The monthly change shows how the index moved from one month to the next. The 12-month change compares the index with the same month a year earlier. Each answers a different question.
A large monthly increase can affect the annual rate gradually as earlier months leave the comparison window. A slower annual rate does not necessarily mean prices have fallen. It usually means prices are rising more slowly than during the comparable period. For the price level to decline, the index itself would need to fall.
Seasonally adjusted and unadjusted figures also differ. Seasonal adjustment attempts to account for recurring patterns, such as predictable changes in some prices at certain times of year. The annual CPI rate is generally reported without seasonal adjustment. Comparing figures requires checking which version is being used.
The September report shows why categories matter
In September, gasoline prices rose 9.1% from August and accounted for more than half of the monthly increase in the all-items CPI, according to the BLS. The broader energy index rose 5.2%. Food prices were unchanged overall: food purchased for home fell 0.1%, while food away from home rose 0.2%.
Shelter prices increased 0.4% during the month. The index for all items excluding food and energy also rose 0.3%, the same monthly pace reported in August. Over the year, shelter was up 3.2%, while the core index was up 2.6%.
These differences matter because one volatile category can move the headline number sharply, while other household expenses change at a different pace. The report’s tables show both the size of each category’s price change and its relative importance in the index. A large percentage move in a smaller category may contribute less to the overall CPI than a modest change in a category that carries more weight.
Why core CPI is only one lens
The CPI excluding food and energy is often called core CPI. It leaves out two categories whose prices can move sharply, which can make underlying patterns easier to see. But households still pay for food and energy, and those expenses can have a direct effect on budgets.
Core CPI is a useful comparison, not a complete measure of living costs. The headline and core indexes answer related but different questions. A report can show a large energy-driven headline increase alongside a slower core reading, or the reverse.
Housing costs also need careful interpretation. The shelter component includes measures such as rent and owners’ equivalent rent, which estimates the value of housing services for homeowners. It is not a direct index of home sale prices or mortgage payments. Rent changes and housing purchase prices can move differently, and the CPI’s shelter measures may adjust more slowly than prices that change frequently.
What today’s release can and cannot tell us
The October report will add one month of observations to the inflation picture. Its components may help explain whether price increases were concentrated in a few categories or spread across a wider range. The report alone cannot establish what caused every change, how long it will last, or what a central bank will do next.
Interest-rate decisions depend on more than one inflation print. Policymakers also consider employment, economic activity, financial conditions, and their assessment of future risks. A CPI release can shape expectations, but it does not mechanically determine policy or market prices.
The BLS notes that some CPI indexes from the most recent 10 to 12 months may be revised. Monthly seasonally adjusted figures can also be affected by updated seasonal factors. That is another reason to read the report as one data point in a developing series.
When the October numbers are released, the first questions are straightforward: What changed month to month? What happened over the year? Which categories drove the move? Did the headline and the index excluding food and energy tell similar stories? Those comparisons help explain the report without treating a single figure as a complete account of household costs.
Sources and further reading
- BLS: Consumer Price Index for September 2026
- BLS: November 2026 release schedule
- BLS: CPI frequently asked questions
- BLS: Why published CPI averages differ from individual experiences
This article explains economic data for general education. CPI is a U.S. average and may not match an individual household’s experience. It is not a personalized financial recommendation.
Leave a Reply