When a government borrows for a few months, a few years, or several decades, investors usually demand different yields for each maturity. Plot those yields together and the result is a yield curve. It is a compact picture of borrowing costs across time, and it is watched by bond investors, central banks, businesses, and economists.
The curve can help explain how markets are pricing interest rates and risk. It does not give a calendar date for a recession, nor does one curve describe every country or borrower. Its meaning depends on which securities are included, how the curve is measured, and what is happening in the economy.
How to read the curve
The horizontal axis shows the time remaining until a bond matures. The vertical axis shows its yield. A curve may slope upward when longer-term bonds yield more than short-term ones, look nearly flat when yields are similar, or invert when selected short-term yields are higher than longer-term yields.
For example, imagine a government bond yield of 3.2% at three months and 4.0% at ten years. That is an upward slope between those two points. If the three-month yield were 4.4% while the ten-year yield were 3.8%, the same comparison would be inverted. These figures are illustrative only; they do not describe current market rates.
Real curves contain many maturities, so analysts often compare a particular pair, such as three-month and ten-year government yields. Other measures compare two-year and ten-year yields or use forward rates implied by bond prices. Those choices can produce different signals on the same day.
Why long and short yields differ
A short-term government yield is influenced by the current policy rate and expectations for policy over the near future. Longer yields reflect a longer stream of expected short-term rates, together with compensation investors may require for tying up money and taking interest-rate risk. Inflation expectations, government borrowing, demand for safe assets, and market liquidity can also affect prices and yields.
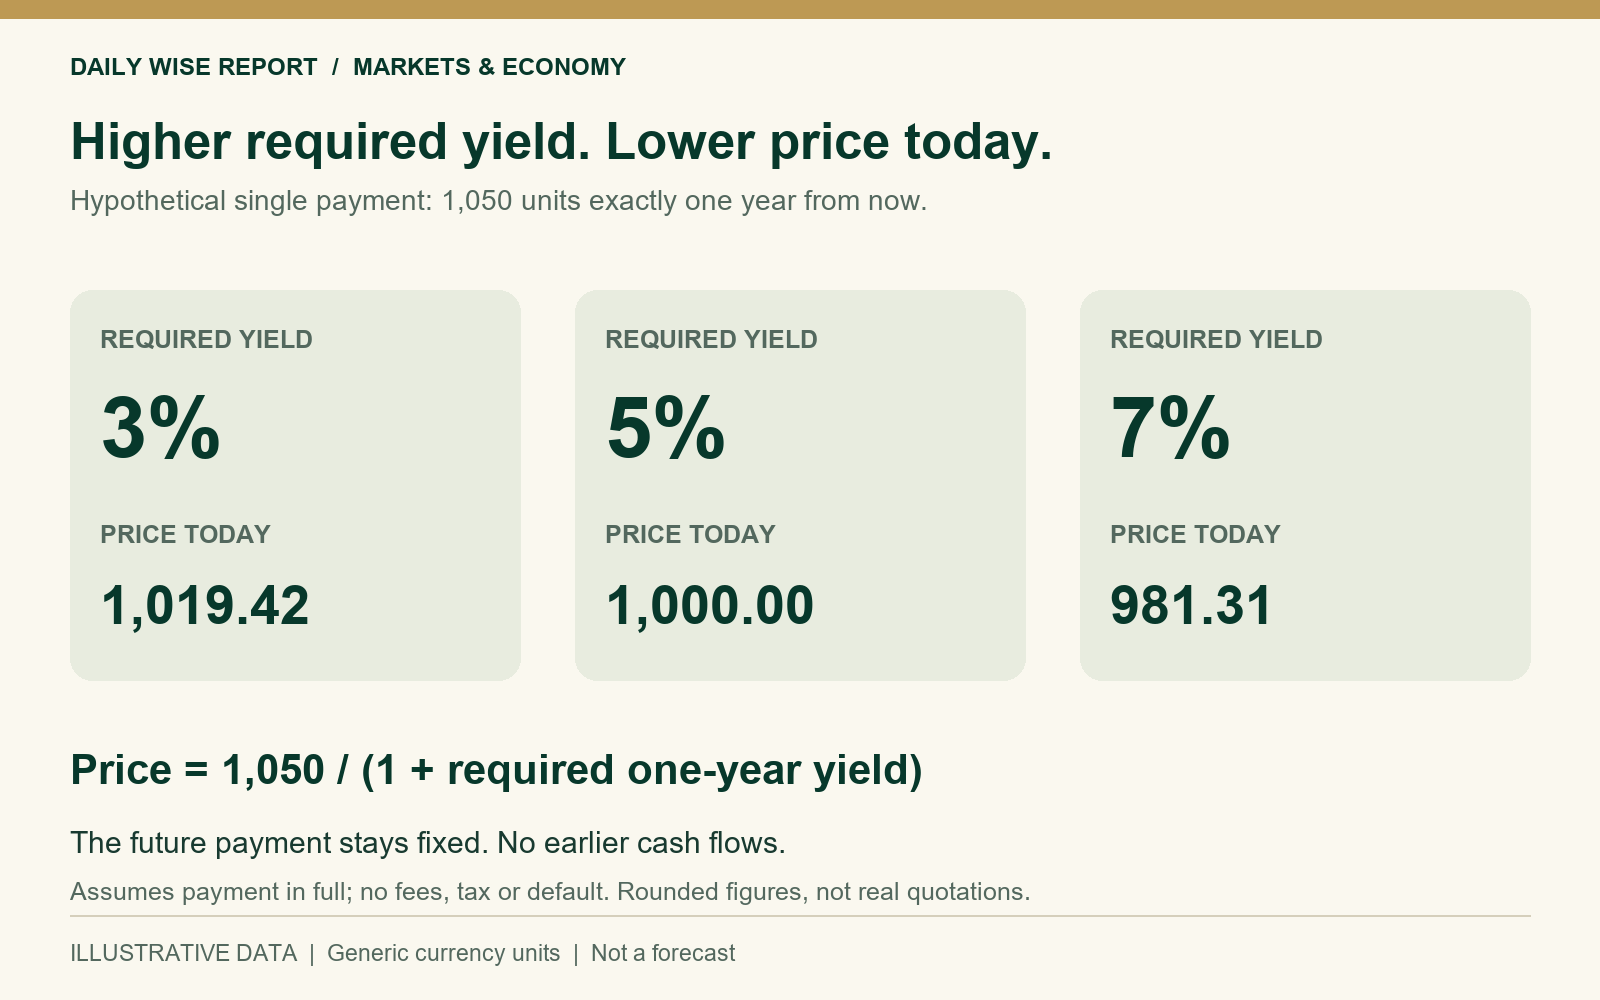
Bond prices and yields move in opposite directions. When investors bid up the price of an existing bond, its yield falls; when its price falls, its yield rises. A change in a ten-year yield can therefore reflect changing expectations about future policy, a shift in the compensation demanded for risk, or both. The Federal Reserve’s term-structure models explicitly separate expected average short rates from a term premium, while noting that this split is model-based rather than directly observed.
Why an inverted curve attracts attention
In the United States, an inversion between selected Treasury maturities has historically been associated with slower growth and higher recession risk over subsequent quarters. One explanation is that markets expect policy rates to fall in the future, often because they expect economic conditions to weaken. At the same time, a central bank may have raised short-term rates to restrain inflation, pushing the front end of the curve up.
That relationship is statistical, not mechanical. The New York Fed publishes a model that uses the spread between the ten-year Treasury yield and the three-month Treasury rate to estimate the probability of a U.S. recession twelve months ahead. The bank says those estimates are not official forecasts. Its model is one way to summarize historical relationships, not a promise about what happens next.
Why the signal can mislead
A curve can invert without an immediate recession, and a recession can develop for reasons that a yield spread did not capture. The sample of past downturns is limited, and the relationships between rates and output can shift as financial markets and policy frameworks change. A single indicator cannot reflect every household, company, or country at once.
Term premiums add another complication. If investors accept unusually low compensation for holding long bonds, long yields can fall even when expectations for short-term rates have not changed by the same amount. Central-bank bond purchases, pension demand, regulations, or a global search for safe assets may affect that premium. Analysts can adjust for an estimated term premium, but the result depends on the model used.
Timing is also easy to overstate. A yield curve does not say that a downturn will begin on a particular date. The New York Fed’s commonly cited spread is used to estimate recession probability over a twelve-month horizon. Even a probability model assigns uncertainty; it does not identify the exact month, severity, or cause of a future contraction.
Curves differ across countries and markets
There is no single global yield curve. Each curve is built from a chosen set of bonds or interest-rate instruments, often issued by a national government. Currency, inflation history, fiscal conditions, central-bank policy, market depth, and the credit standing of the issuer all matter. A curve built from euro-area government bonds, for example, does not answer precisely the same question as a U.S. Treasury curve.
Even within one country, a sovereign curve and a corporate borrowing curve differ. A company generally pays a spread over a reference rate to compensate lenders for credit and liquidity risks. That spread can widen when investors become less willing to lend, even if government yields are falling. For a fuller picture, analysts often look at credit spreads, inflation measures, employment, lending conditions, and surveys alongside the yield curve.
What the curve is useful for
The curve is useful as a map of current bond-market pricing. Borrowers can compare funding costs by term, investors can see how yields vary with maturity, and policymakers can monitor how markets interpret their decisions. A changing slope may prompt questions about expected policy, growth, inflation, or risk appetite.
It works best as one piece of evidence. Before interpreting a headline about an inversion, check which maturities and country it refers to, whether it uses government bonds or another benchmark, and whether the article is reporting an observed yield or a model’s probability estimate. Then compare that signal with other data. The curve can sharpen a discussion about economic risk; it cannot settle the discussion on its own.
Sources and further reading
- Federal Reserve Board: Yield Curve Models and Data
- Federal Reserve Bank of New York: The Yield Curve as a Leading Indicator
- Federal Reserve: There Is No Single Best Predictor of Recessions
This article explains general economic concepts. Yield curves and their interpretation vary by market and methodology; this article is not an investment recommendation.
Leave a Reply