Why Inflation Feels Different from One Household to Another
One published rate summarizes many prices. It cannot describe every household’s basket, income, or housing situation.
A household pays its own mix of rent, food, transport and utilities. A published inflation index averages a defined mix of prices, so it can differ from the household’s experience even when both are measured correctly.
The US Bureau of Labor Statistics explains that its Consumer Price Index is a statistical average based on a defined population and basket. Households whose spending differs from that basket can experience different price changes. Other countries use their own index populations and methods. [1]
Two hypothetical baskets
Consider two households, each initially spending 1,000 currency units. For simplicity, divide their expenditure into essentials and other purchases. Assume essentials rise 10% and other prices rise 2%, with the quantities and quality of everything purchased unchanged. These are invented rates for explanation, not current inflation figures.
| Basket | Essentials | Other purchases | New cost | Increase |
|---|---|---|---|---|
| Household A | 700 → 770 | 300 → 306 | 1,076 | 7.6% |
| Household B | 400 → 440 | 600 → 612 | 1,052 | 5.2% |
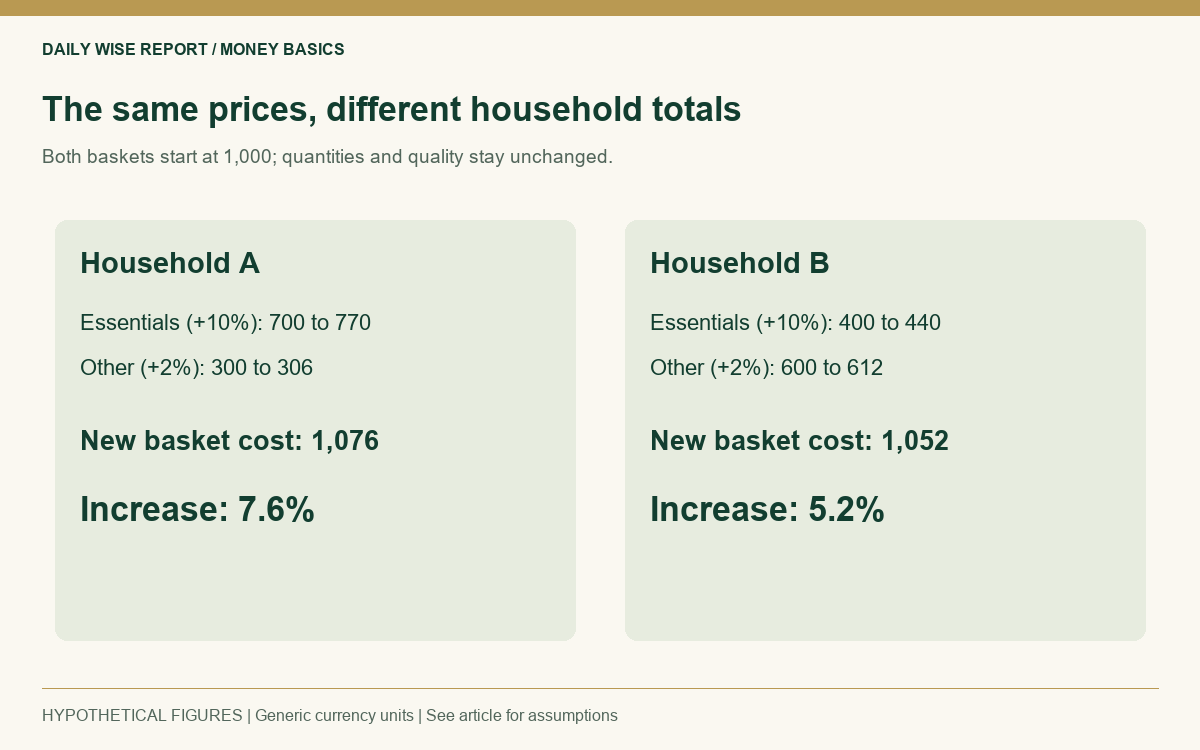
No price in this example changes differently for A and B. The different totals come entirely from their initial expenditure shares. An index based on a third set of weights could report another result. BLS describes how expenditure weights give components different importance in the overall index. [2]
Spending more is not the same as inflation
A higher electricity bill during cold weather may combine a tariff increase with greater energy use. Other bills can rise when the household switches products. Total spending alone cannot separate a price change from a change in what or how much was bought.
The example holds quantities constant. People may instead substitute products, postpone purchases or consume less. Those responses can hold spending down while leaving them with fewer goods or less convenience.
Income changes the consequence
Price changes alone do not describe affordability. If a household’s income rises more slowly than the prices of its purchases, purchasing power falls. The IMF discusses this distinction between nominal income and real income, and notes that wages and other prices do not all adjust at the same speed. [3]
In a separate hypothetical example, income rises 3% while the relevant fixed basket rises 6%. Purchasing power changes by 1.03 ÷ 1.06 − 1, approximately −2.83%. Simply subtracting the rates gives a useful approximation but not the exact percentage.
Negative effects are uneven
Households with little flexibility in essential spending can face difficult trade-offs when those prices rise. A fixed payment may retain its currency amount while covering less consumption. A nominal increase in savings or wages can therefore coexist with reduced purchasing power.
An unchanged fixed mortgage payment and a rent increase create different immediate pressures. Housing arrangements, contract dates and local availability also matter, alongside maintenance, interest resets, other expenses and income changes. They prevent a simple conclusion that one group always gains or loses.
What a headline can and cannot show
A published rate applies to a defined basket, population and period. Comparing it with a household bill requires matching the time window and separating price changes from quantities bought. These examples supply no estimate of an individual reader’s inflation rate.
Sources and scope
[1] BLS: Published averages and individual experiences. [2] BLS: CPI weights. [3] IMF: Inflation. The BLS discussion concerns US measures; its exact rules are not assumed to apply globally. All household numbers above are hypothetical.
Leave a Reply