GDP Growth Can Look Stronger Than the Economy Feels
Nominal output, inflation-adjusted output and output per person answer different questions. None directly measures every household’s living standard.
GDP can grow while some residents see little improvement in their finances. Higher prices may account for part of the increase, and population growth can leave less output per person. Even when output per person rises, the gains may be distributed unevenly.
Nominal GDP, real GDP and output per person
The IMF’s GDP explainer describes gross domestic product as the value of final goods and services produced within an economy over a period. Nominal GDP uses current prices; real GDP adjusts for price changes. These are measures of production, not a direct account of a household’s spendable income.
Consider a fictional economy with the following annual figures. Units and population counts are deliberately simplified, so the table illustrates measurement rather than any country’s performance.
| Measure | Starting year | Later year |
|---|---|---|
| Nominal GDP | 1,000 | 1,080 |
| GDP price deflator | 100 | 105 |
| Real GDP | 1,000 | 1,028.57 |
| Population | 100 | 104 |
| Real GDP per person | 10.00 | 9.89 |
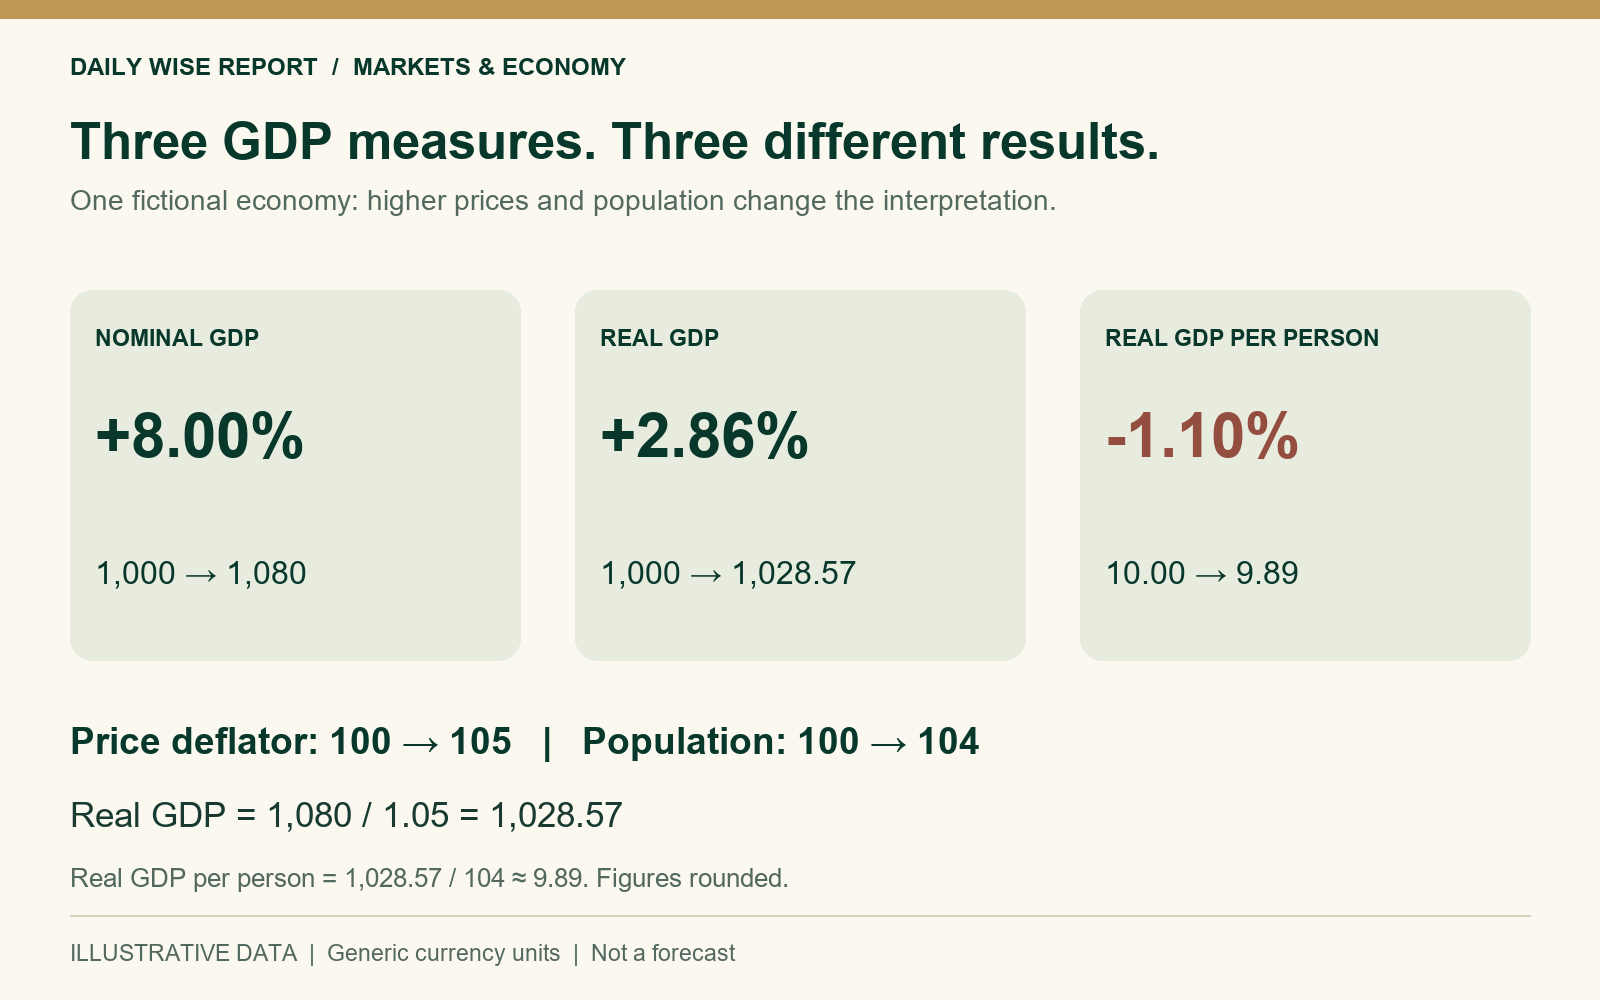
Three growth rates from one example
Nominal GDP rises 8%. Dividing 1,080 by 1.05 gives real output of approximately 1,028.57, an increase of 2.86%. Dividing that result by 104 people gives roughly 9.89 per person, about 1.10% below the starting level.
The 8% figure includes price increases. Adjusting for them leaves growth of 2.86%; accounting for population then gives a per-person decline of about 1.10%. A headline using only the nominal figure leaves those adjustments out.
Output is not the same as welfare
A per-person figure is still an average. Two people could share 100 units equally or receive 90 and 10. The average would be 50 in either case, without describing either person’s actual share. GDP per person is also a production measure, not a payment to each resident.
The IMF also notes that GDP is not a complete measure of well-being. Environmental costs, unpaid household activity and leisure are among the reasons that production and welfare can diverge. A repair following damage can generate measured activity without proving that society is better off than before the damage.
Timing and definitions still matter
A quarterly change and an annual change cover different intervals. An annualized quarterly rate adds another assumption about continuing a short-period pace. Comparing those labels without their periods can exaggerate apparent differences.
Scope and limitations
These are invented values with rounded results. They do not reproduce a national accounts release, forecast a recession or imply any market response. GDP is one part of an economic assessment; the example does not rank countries or investments.
Related reading
A Falling Unemployment Rate Does Not Always Mean More People Have Jobs
Leave a Reply