How Inflation Can Fall While Prices Stay High
An annual inflation rate compares two price levels. A change in the older comparison point can alter the rate even when today’s prices barely move.
Inflation can slow while a shopping bill stays high. The rate measures how fast prices change; the bill depends on current prices and the quantities bought. Even a change in last year’s comparison price can make annual inflation fall sharply.
The price from a year earlier
The European Central Bank’s inflation explainer describes annual inflation as a comparison between a basket’s cost and its cost in the same month a year earlier. The ECB’s technical explanation of base effects shows why past monthly movements can affect changes in that annual rate.
The following imaginary index keeps current prices exactly unchanged between January and February. The corresponding months a year earlier are different.
| Comparison month | Index a year earlier | Current index | Annual change |
|---|---|---|---|
| January | 100 | 110 | 10.00% |
| February | 105 | 110 | 4.76% |
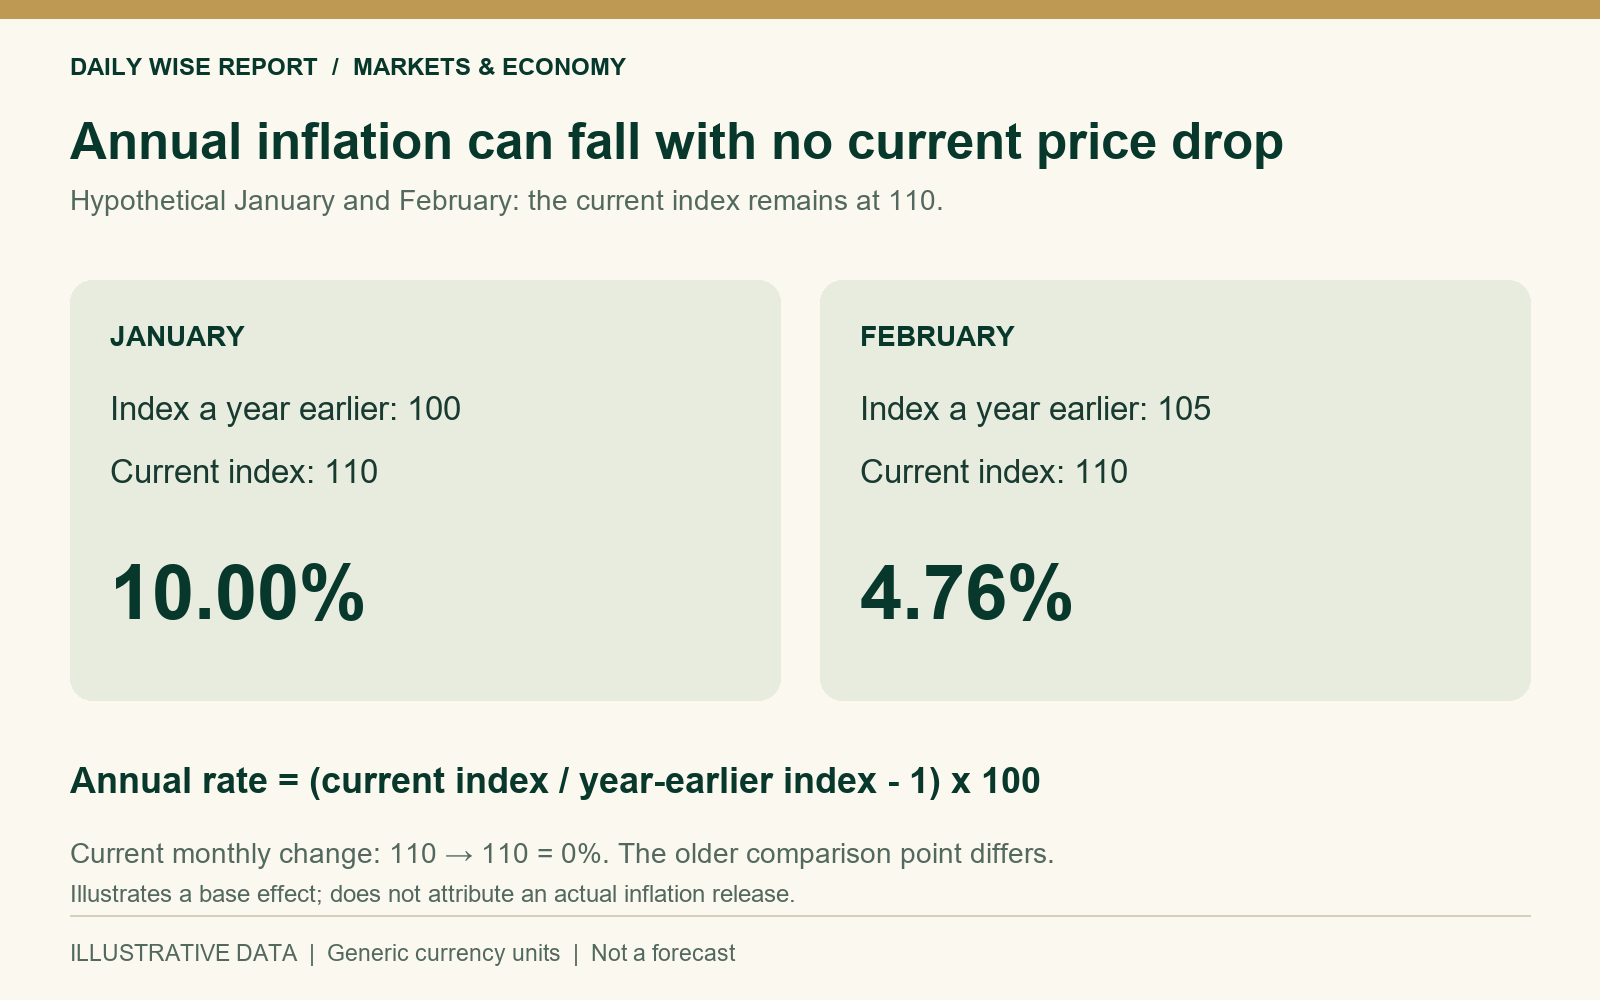
January’s rate is (110 ÷ 100 − 1) × 100, or 10%. February’s is (110 ÷ 105 − 1) × 100, approximately 4.76%. Current prices did not fall. The annual rate declined because February’s older comparison point was higher.
The monthly and annual rates differ
Between the two current months, the index stays at 110, so monthly inflation is zero. The annual calculation falls as the older comparison changes from 100 to 105. This isolates a base effect; real disinflation can also involve changes in current prices.
Actual annual rates combine recent price movements with the influence of earlier movements. Falling energy prices, changing demand, supply conditions and other developments can also matter. An index alone does not identify the cause without more information about its components and timing.
A slower increase leaves a higher level
Suppose a separate basket rises from 100 to 110 and then increases another 2%. Its new cost is 112.20. The second increase is slower than the first, but the basket remains more expensive than at either earlier date. A lower positive inflation rate does not undo the previous rise.
For a household with unchanged cash income, that higher level can continue to constrain purchasing power. The household’s own experience may also differ from the published basket, because expenditure weights are not identical across residents.
Why comparisons need their labels
A month-on-month rate, a year-on-year rate and a change in an index level are separate quantities. Seasonal adjustment may further change the comparison being made. Treating them as interchangeable can make an apparent improvement or deterioration look larger than the underlying numbers establish.
Scope and limitations
All figures are hypothetical. Two comparison months do not establish an inflation trend or predict policy decisions. This article explains arithmetic and possible interpretation limits, without recommending spending or investment action.
Related reading
Why a Central Bank Rate Change Reaches People at Different Times
Leave a Reply