Cost per Kilometre Can Fall While Monthly Driving Costs Rise
Fixed ownership costs are spread across distance. A lower average cost per kilometre does not mean a smaller total cost or a cheaper additional trip.
Driving more kilometres spreads a vehicle’s fixed costs across a larger distance. The average per kilometre can fall even as total cost rises, because each additional journey still incurs variable costs.
Identify which costs change with distance
The US Department of Energy’s Vehicle Cost Calculator uses driving and vehicle assumptions to estimate ownership costs. The general distinction between fuel spending and broader ownership costs is useful even without comparing particular vehicles. Our example is a separate invented model, not an output from that calculator.
Assume monthly fixed economic costs of 210 units: 50 insurance, 120 depreciation and 40 parking. Variable costs are 0.18 per kilometre, split into fuel at 0.12 and a wear-related maintenance allocation of 0.06.
| Measure | 500 km | 1,000 km |
|---|---|---|
| Fixed economic costs | 210 | 210 |
| Fuel | 60 | 120 |
| Wear-related maintenance allocation | 30 | 60 |
| Total modeled cost | 300 | 390 |
| Average per kilometre | 0.60 | 0.39 |
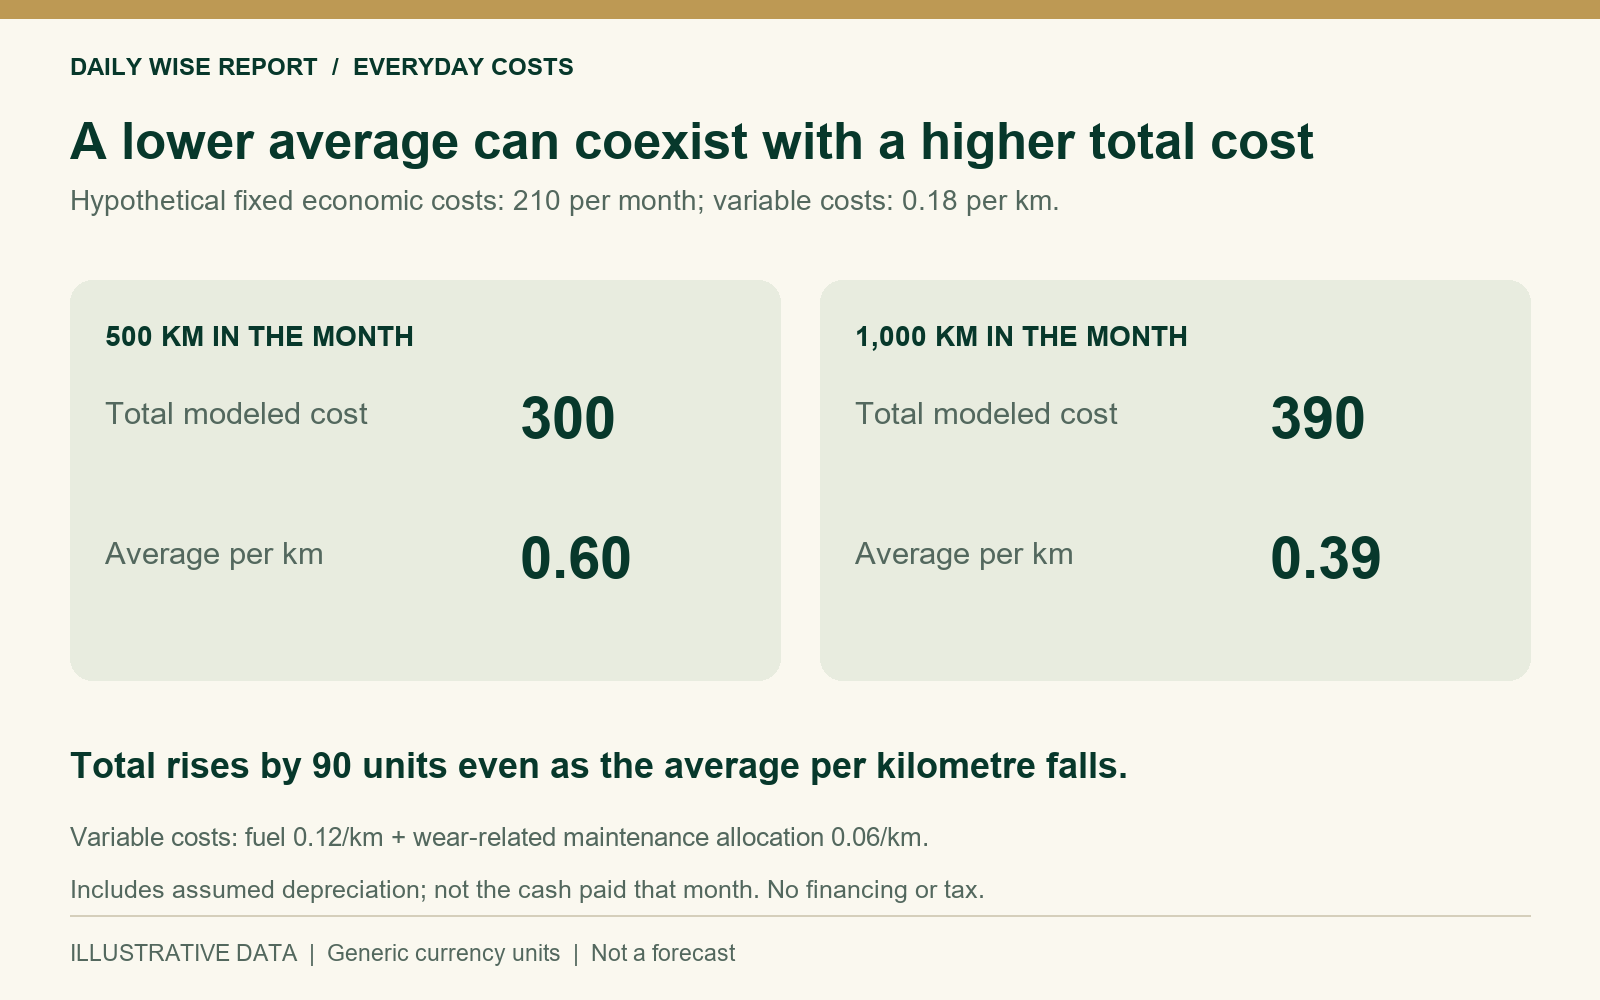
Spreading the fixed 210 over more kilometres
At 500 km, fixed costs contribute 210 ÷ 500, or 0.42 per kilometre. Adding 0.18 variable cost gives an average of 0.60. At 1,000 km, the fixed share falls to 0.21, producing an average of 0.39.
The average falls 35%, from 0.60 to 0.39 per kilometre, while total modeled cost rises 30%, from 300 to 390. A lower average therefore accompanies a larger monthly cost in this example.
An additional trip has a different cost boundary
Another 100 km adds 18 in variable costs if fixed costs stay unchanged. Extra parking, tolls or a maintenance threshold could add to that amount; the calculation also excludes the value of travel time.
Likewise, removing a short journey does not automatically eliminate insurance or depreciation. If a different arrangement changes whether a vehicle is owned at all, the comparison includes a broader set of costs than one additional trip.
Economic cost differs from cash paid that month
The depreciation figure is an assumed loss of asset value, not a monthly invoice. Maintenance is allocated by distance even if the cash repair bill arrives later. Adding an entire purchase price or loan-principal payment to the same depreciation calculation would mix different accounting approaches.
Scope and limitations
Actual depreciation, repairs, finance charges, fuel prices and travel needs vary. The model excludes financing, tax and resale transactions. It explains totals and averages without recommending a vehicle, travel mode or amount of driving.
Related reading
Lower Rent Does Not Always Mean Lower Monthly Living Costs
Why Using Less Electricity May Not Lower the Bill by the Same Percentage
Leave a Reply